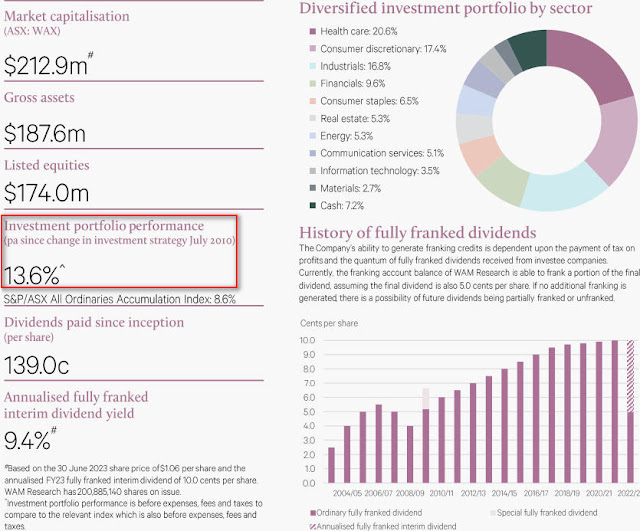
Summary: Wilson Asset Management's LIC funds long-run outperformance figures are a fantasy. In this post, I reveal the true performance of WAM Research (WAX), it's second oldest fund (Aug 2003) and the oldest that can be compared since inception against an Australian index ETF (STW was the first in Aug 2001). I also compare performance since Wilson's self-selected WAX reset date of July 2010. Notably, I couldn't find a single finance website in Australia that has published details on the reality of Wilson Asset Management funds' performance.
 |
| Wilson Asset Management performance figures are a mirage |
Details:
The aim of these "Cheat Sheets" is to reveal how difficult it is, even with genuine expertise, to outperform cheap index funds with CEFs in the long run. I reveal just one important but little known insight for each ASX CEF. It is not the only insight; nor always the most important one. I vary the insights to show how unnecessarily complex and hazardous CEF investing is. For detailed ASX CEF insights and expert services please use the Contact page.
1. WAX Key Facts
30 June 2023:
Share Price: $1.10. Pre-tax NTA: $0.93. Premium: 18%
It's June 2023 Monthly Report states a 13.6% annualised "Investment portfolio performance" since the "change in investment strategy in July 2010."
2. WAX Key Insight
- Wilson Asset Management steadfastly refuses to report performance figures after fees and costs. It only reports its "investment portfolio performance" which is "before expenses, fees and taxes." It could easily also report an after all expenses and taxes figure but that evaporate its myths of long-run outperformance - let alone the astonishing long-run performance figures it publishes.
- However, it's easy to investigate any ASX listed product's true performance returns using Sharesight and compare with some relevant, low-cost index ETFs. Franking credits are included by Sharesight and annualised figures are CAGR. Unless noted by exception, I report fund performance with dividend re-investing Off as it's Off for the benchmark too. See: > How Sharesight calculates your investment performance; Sharesight Benchmarking
TSR Using Original WAX 31 Aug 2003 Inception Date to 30 June 2023:
- STW (chosen for its early inception): 7.02% annualised. WAX has returned 7.43% (dividends reinvested).
TSR Using 1 July 2010 WAX-chosen Revised Start Date to 30 June 2023:
- STW: 7.54% annualised. WAX: 11.56% annualised.
- Note this is cherry-picking, and WAX moved from a discount to a significant premium in this period.
TSR 10 years to 30 June 2023:
- STW: 8.07% annualised. WAX: 8.6% annualised.
- The most recent 10 year period for a fund is long enough to compare the performance figures it advertises (~13.6%), and outperformance it claims, versus the reality.
For CEFs with big moves in the direction of a Premium to NTA, TSRs need a closer look
Remember, in the 5yrs to 28 July 2023, WAX has traded at a massive Premium range of: +7.7% to +52.7%. The current premium is 18%. So it hasn't been a continual climb, let alone a steady one.
Hence, the above TSR figures are significantly affected if the end point for a measurement period was at the high end of its discount-premium range.
If investing evidence on active management is correct, and so it's almost impossible for a CEF with a significant Total Expense Ratio (TER) to outperform the best alternate index fund in the long run, we should expect any CEF to inevitably move in the direction of greater discounts. This is especially dangerous for investors in CEFs trading at higher premiums or lower discounts than is justified in the long run.
Sure enough, the most recent years have started to see WAX significantly underperform in TSR:
TSR 5 years to 30 June 2023:
- STW: 7.56% annualised. WAX: 2.59% annualised.
- The most recent TSR returns are much worse than STW due to the premium it started at.
NTA 10 years to 30 June 2023:
- 30 June 2013 Pre-tax NTA: $1.034. 30 June 2023 Pre-tax NTA: $0.93
- NTA returns can be calculated in Sharesight by manually setting the NTA at the start and end.
- WAX has outperformed before expenses but after all expenses it has trailed STW (8.12% to 7.68%)
In Summary:
Over the last 10 years, WAX's NTA return was 7.68% annualised and TSR return 8.6% (the latter inclusive of trading at a 18% premium).
Circa 8% is a long way from the 13.6% figure, and significant outperformance of its benchmark, that it advertises. The gap between them is indicative of the difference WAX's TER makes (and the size and impact of TERs on the true performance of Wilson Asset Management funds generally).
Now that you have the real facts, re-read the performance figures and statements in the WAX 2021-22 annual report to 30 June 2022 that covers these periods and decide for yourself how accurate or misleading they are:
Links:


